描述
Highcharts
功能介紹
Highcharts是透過JavaScript元件為網站增加圖表,支援的圖表類型有直線圖、曲線圖、區域圖、柱狀圖、餅狀圖、散狀點圖、儀錶圖、氣泡圖、瀑布流圖等多達 20 種圖表,其中很多圖表可以集成在同一個圖形中形成混合圖,適用於行動裝置及桌上型電腦的瀏覽器像是iPhone/iPad及IE 6,能夠很簡單便利的在網站或是web應用程序添加有交互性的圖表。讓資料視覺化更簡單,相容 IE6+、完美支援移動端、圖表類型豐富、方便快捷的 HTML5 交互性圖表庫。。
功能特色
與您的堆棧(stack)一起使用
我們所有的圖表庫都可與任何後端數據庫或服務器堆棧一起使用。數據可以任何形式給出,包括CSV,JSON或live的加載和更新。Highcharts或我們的社區提供了適用於大多數流行語言(如.Net,PHP,Python,R和Java以及iOS和Android)的包裝器以及Angular,Vue和React等框架的包裝。
觸控和行動優化
智能響應能力不僅使圖表適合容器的尺寸,還可以將非圖形元素(例如標籤,圖例和標題)自動放置在最佳位置。
多點觸摸手勢支持可在移動和触摸屏上提供原生體驗。
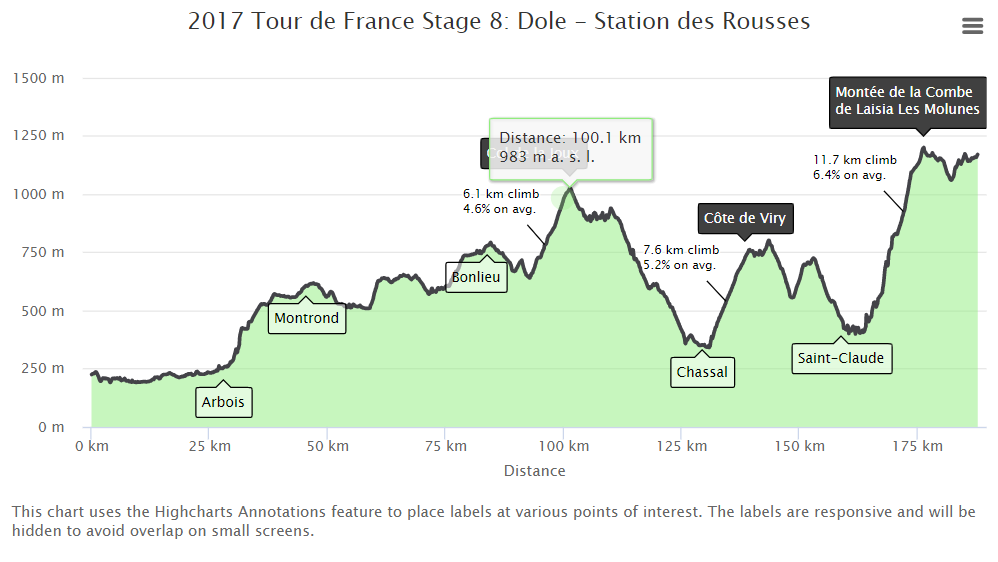
註釋,支持用戶互動
利用註釋,開發人員可以通過在畫布上的任意位置繪製或將其鏈接到特定數據點的簡單形狀和文本來描述圖表或數據點。註釋模塊包括用於構建用戶界面(例如按鈕,工具欄和對話框)的API,使最終用戶能夠在圖表上放置自己的註釋。
面向最終用戶的成熟編輯器
免費的Highcharts編輯器使開發人員只需幾行代碼即可將功能齊全的圖表編輯器嵌入其CMS或Web應用程序。
調試器
該Highcharts調試器將幫助您通過上面提供的圖表即時警告和錯誤報告加快發展。錯誤消息提供了有關如何解決問題的明確說明。
可選的選項
在大多數情況下,圖表的外觀和行為完全符合您的需要而無需修改。一個簡單的選項結構允許進行深度自定義,並且樣式可以通過JavaScript或CSS進行。Highcharts對於尋求高級動畫和功能的專家也可以擴展和插入。
瀏覽器中的資料處理
使用Highcharts,可以在客戶端中對源資料進行後處理,以改善用戶體驗。從版本8開始,您可以將標記群集啟用為散點圖類型的圖表,並從3種群集演算法中進行選擇。
打字稿
TypeScript聲明的集成,Highcharts NPM軟件包允許對大多數Highcharts選項和功能進行類型檢查,包括自動完成代碼以及集成了具有TypeScript功能的編輯器。
輔助功能與聲音化
Highcharts 為視障用戶和僅使用鍵盤瀏覽的用戶提供了業界最完善的可訪問性支持,可以滿足並超過第508節的要求和WCAG 2準則。還包括一個基本的Sonification API,該API支持多種方法來使聲音變得栩栩如生。
充滿活力的社群
Github,StackOverflow和其他論壇上所有高級圖表工具中最大的開發人員社區渴望在需要時提供更多幫助,特定於平台的實施建議和靈感。
大數據就緒
當您需要在瀏覽器中渲染成千上萬個數據點時,我們基於WebGL的增強模塊提供的速度可讓Plotly,圖表和其他以性能為中心的圖表庫塵埃落定。
匯出及列印
隨著出口模塊啟用,用戶可以在點擊按鈕的圖表導出到PNG,JPG,PDF或SVG格式,或直接從網頁打印圖表。
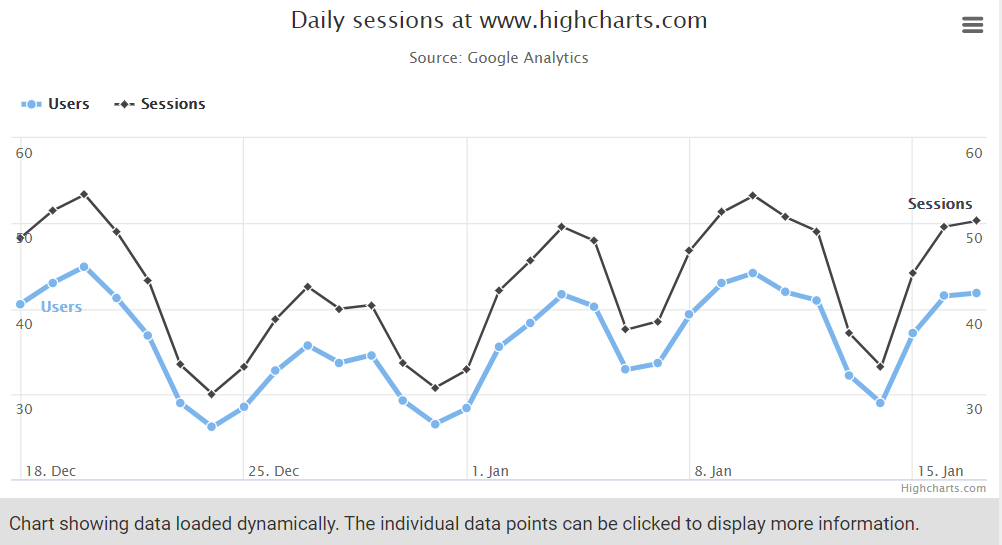
動態
許多事件為根據圖表進行編程提供了掛鉤,從而可以輕鬆地通過即時動態的資料更新和可自定義的動畫演示資料之間的複雜關係。資料可以以任何形式(甚至來自不同站點)處理到Highcharts,還具有用於將數據解析為數組的回調函數。
可用資源
對於所有許可證類型,包括免費的非商業許可證,都允許您下載源代碼,檢查源代碼並進行自己的編輯。
系統需求
System requirements
Client-Side System Requirements
Highcharts and Highstock work in all modern browsers including mobile devices and Internet Explorer from version 6. Standard browsers use SVG for the graphics rendering. In legacy Internet Explorer (IE8 and before) graphics are drawn using VML.
Highcharts and Highstock run on any server that supports HTML. You can even run Highcharts locally from a filesystem, since all the rendering is done locally in a browser.
BROWSER COMPATIBILITY
We test our software on many browsers using the latest versions. Knowing that Internet Explorer users have a tendency not to upgrade we also systematically test older versions of that browser. Highcharts runs on the following browser versions:
|
Brand
|
Versions supported
|
|
Internet Explorer
|
6.0 +
|
|
Firefox
|
2.0 +
|
|
Chrome
|
1.0 +
|
|
Safari
|
4.0 +
|
|
Opera
|
9.0 +
|
|
iOS (Safari)
|
3.0 +
|
|
Android Browser
|
2.0 + *)
|
*) Android browser 2.x has limited support, see below.
JAVASCRIPT FRAMEWORKS
Our products rely on external JavaScript frameworks to do DOM manipulation, animation and event handling. We try to keep the interface between our library and the JavaScript framework as small as possible, the adapter classes that serve as a bridge to the JavaScript frameworks are about 10 methods long.
We have built-in support for jQuery and we bundle adapter classes for use with Mootools and Prototype. The strategy we have chosen is to always test the latest versions (possibly with a small delay) and to also include the latest patch on earlier versions. Currently our test-framework runs unit tests for the following versions of javascript libraries:
|
jQuery
|
Mootools
|
Prototype
|
|
1.8.2+
|
1.4.5
|
1.7
|
|
1.7.2
|
1.3.2
|
|
|
1.6.2
|
1.2.5
|
|
|
1.5.2
|
|
|
|
1.4.4
|
|
|
|
1.3.2
|
|
|
Other versions may still work even though they are not tested.
RENDERING ENGINES AND PERFORMANCE
Different browsers support different rendering technologies, modern browsers have support for SVG but older versions of Internet Explorer do not, here we use VML to draw the graphs. This table describes the technologies we use in various browsers:
|
Browser version
|
Rendering technology
|
Rendering performance
|
|
Microsoft Edge
|
SVG
|
Excellent
|
|
Internet Explorer 9, 10, 11
|
SVG
|
Excellent
|
|
Internet Explorer 8
|
VML
|
Ok
|
|
Internet Explorer 7
|
VML
|
Slow
|
|
Internet Explorer 6
|
VML
|
Slow
|
|
Firefox
|
SVG
|
Excellent
|
|
Chrome
|
SVG
|
Excellent
|
|
Safari
|
SVG
|
Excellent
|
|
Opera
|
SVG
|
Excellent
|
|
iOS Safari
|
SVG
|
Ok
|
|
Android 3+
|
SVG
|
Ok
|
|
Android 2.x
|
Canvas
|
Slow
|
ANDROID 2.X
Android 2.x doesn’t have SVG support built in, so we have created a separate renderer based on the canvg library for this system. This solution has some limitations:
- Shared tooltip is always enabled.
- During first render, the canvg renderer + rgbcolor.js + canvg.js (concatenated to one file) will be downloaded from code.highcharts.com This is configurable with the global.canvasToolsURL option.
- Chart and series animation is turned off.
- Show/hide series from the legend is not enabled.
- Series and point touch events are not enabled.
- Zooming is not enabled.
- Using the Renderer API directly to add shapes to the charts is not supported.