描述
nQuery 樣本大小分析統計軟體
產品特色
Randomization Lists Tool
(Included in the All Tiers)
Randomization Lists
nQuery 9.2 sees the addition of the Randomization Lists tool which allows for the easy generation of randomization lists that account both for randomization and any balancing covariates of interest.
The initial release will include the following algorithms for generating randomization lists:
- Block Randomization
- Complete Randomization
- Efron’s Biased Coin (2 Groups Only)
Randomization is a vital part of ensuring valid statistical inferences from common statistical tests used widely in clinical trials. Randomization creates treatment groups that are comparable and reduces the influence of unknown factors. However, in clinical trials there are often ethical and logistical considerations that mean that simple random allocation may not be appropriate.
For example, it is often considered important to ensure that balance is maintained at any given time during a clinical trial to reduce the potential effect of time-varying covariates or when sequential analysis is planned. Additionally, it can be important that covariates such as gender are relatively balanced overall.
The Randomization Lists tool will allow the user to generate randomization lists for trials with up to 25 treatments and centers (such as hospitals), and up to 2 additional stratification factors (such as age or gender) with up to 25 strata allowed for each. In addition, the user will be given algorithm-specific options (such as block size for block randomization) and the ability to add block or subject-level IDs for easier understanding and communication with stakeholders.


4 New Adaptive Tables
(Included in the Pro Tier)
What’s new in the PRO tier of nQuery?
4 new sample size tables have been added to the Pro tier of nQuery 9.2.
- Blinded Sample Size Re-estimation x 2
- Two-Stage Bioequivalence Testing (Potvin)
- Litwin’s Phase II Design for PFS
Blinded Sample Size Re-estimation
What is it?
Sample size determination always requires a level of uncertainty over the assumptions made to find the appropriate sample size. Many of these assumed values are for nuisance parameters (such as the variance) which are not directly related to the effect size. Blinded sample size re-estimation allows the estimation of improved estimates for these nuisance parameters without unblinding the study.
In nQuery 9.2, blinded sample size re-estimation using the internal pilot approach is implemented for two models for the analysis of incidence rates and counts: the Poisson Regression and the Quasi-Poisson (Overdispersed) Regression models. Incidence rates are a common endpoint in areas such as the rate of hospitalizations or exacerbations in respiratory diseases such as asthma and COPD. Counts are a common endpoint in areas such as screening and diagnostics such as MRI scans for the number of lesions in multiple sclerosis.
In both models, the internal pilot is used to re-estimate the overall event rate and the Quasi-Poisson internal pilot also provides an estimate of the overdispersion parameter.
Two-Stage Bioequivalence Testing (Potvin)
What is it?
Bioequivalence testing is the most common route for the approval of new generic medicines. This testing consists of evaluating if the pharmacokinetics (PK) parameters Area under the Curve (AUC) and maximum concentration (Cmax) are equivalent using the two one-sided tests (TOST) or (equivalent) confidence interval approach.
Crossover designs are designs where each subject is given multiple treatments in a pre-specified sequence. The most common crossover design is a 2×2 design where each subject is given treatment with half given treatment then control and other half given control and then treatment. Most bioequivalence testing is done via fixed term crossover designs where analysis is conducted after all followup is complete.
However, two-stage bioequivalence designs have been proposed by researchers such as Diane Potvin. These two-stage designs allow both for the early evaluation of bioequivalence and to also adjust the sample size appropriately if the variance was misspecified for the initial sample size determination.
In nQuery 9.2, a table is added for the calculation of the overall power or required stage 1 sample size for a two-stage bioequivalence design with defaults provided for Decision Schemes B, C and D from Potvin (2007). The user also has flexibility to design other two-stage designs such as those of Fulsang (2013) or Kieser & Rauch (2015).
Litwin’s Phase II Design for Progression Free Survival
What is it?
Phase II designs are often used to determine whether a new procedure or treatment is likely to meet a basic level of efficacy to warrant further development or evaluation and which dosage levels should be evaluated at Phase III.
Phase IIa designs are focussed on the proof-of-concept part of Phase II trials. They aim to show the potential efficacy and safety of a proposed treatment. Two-stage designs are common to allow for flexibility to stop trials early for futility as Phase II is the most common failure point in drug evaluation.
In nQuery 9.2, we have implemented Litwin’s (2007) proposed two-stage Phase II design for the evaluation of progression-free survival for survival analysis in a Phase IIa trial. In this design, efficacy is measured as the proportion of the sample that has not experienced disease progression (are “progression-free”) at an early and later time point. Early stopping for futility is considered at the early time point if an insufficient number of patients are progression-free.
Progression-free Survival (PFS) is a useful clinical trial endpoint for cases where therapeutics lead to stabilization of an illness but not necessarily a cure. For example, non-cytotoxic anticancer agents in oncology have been found to cause prolonged tumour stabilization rather than shrinkage.
4 New Bayesian Tables
(Included in the Plus & Pro Tier)
What’s new in the PLUS tier of nQuery?
4 new sample size tables have been added to the Plus tier of nQuery 9.2.
- Bayesian Average Error x 3
- Inequality Testing using Bayes Factor
Bayesian Average Error
What is it?
Under the classical framework, sample size calculations are aimed at adequately maintaining pre-specified Type-I and Type-II errors rates. However, several drawbacks exist for this approach of controlling each error individually including that this will often result in larger sample sizes than necessary. These limitations have motivated several Bayesian solutions.
In nQuery 9.2, sample size determination using the Bayesian Average Error (BAE) method is implemented. The BAE extends the classical perspective by automatically determining the required cut-off value for a test statistic that maintains a target level of the total error rate instead of specifying bounds for the Type-I and II errors individually. This may be more appealing when control of the total error is of interest.
Bayes Factor
What is it?
Bayes factors have been described as the Bayesian equivalent of the p-value. Using Bayes factors allows evaluation of evidence in favor of the null hypothesis, as opposed to in frequentist settings where evidence can only be found in favor of the alternative hypothesis.
For inequality (superiority) testing, the Bayes Factor can be calculated as the ratio of the probability of the given data being observed under the alternative hypothesis (i.e. inequality) to the probability of the data being observed under the null hypothesis (i.e. equality).
In nQuery 9.2, a table is added to our Bayes Factors options for the case of testing two independent means. The sample size is chosen to make it a priori probable that the Bayes factor is greater than a given cut-off of prespecificed size.
15 New Base Tables
(Included in all packages: Base, Plus & Pro Tiers)
What’s new in the BASE tier of nQuery?
15 new sample size tables have been added to the Base tier of nQuery (V9.2).
- 8 Proportions Tables (Stratified Analysis, Ordinal Data, Paired Proportions)
- 7 Survival Tables (MaxCombo, Linear-Rank Tests, Accelerated Failure Time (AFT) Model, Win Ratio for Composite Endpoints)
Proportions
What is it?
Proportions are a common type of data where the most common endpoint of interest is a dichotomous variable. Examples in clinical trials include the proportion of patients who experience tumour regression. There are a wide variety of designs proposed for binary proportions ranging from exact to maximum likelihood to normal approximations.
Stratified Analysis for Two Proportions
What is it?
In stratified designs, subjects are categorized into strata prior to randomization to the control and treatment groups. This is because it is felt that the response proportions will vary depending on important covariates such as age or gender.
For stratified designs involving the analysis of an endpoint with two categories (e.g. yes/no, disease/no disease), the most commonly used analysis is the Mantel-Haenzsel-Cochran test. Assuming a constant odds ratio across each strata, this test allows analysis of an appropriately weighted test statistic for the effect across the strata.
In nQuery 9.2, sample size determination for the analysis of two proportions in a stratified design using the Mantel-Haenzsel-Cochran test is provided for the inequality testing when there is unequal sample size within each strata, non-inferiority testing and for a cluster randomized design.
Proportional Odds Model for Ordinal Data
What is it?
Ordinal or ordered categorical data occurs where responses can be split into separate categories which can be ordered in some way. This is a common type of data in areas such as diagnostics for pain or mental illness. For example, a patient may participate in a survey in which they describe their response as good, moderate, or bad.
The Proportional Odds model is a widely used method for the analysis of ordinal data. In the proportional odds model, it is assumed there is a constant odds ratio of a patient being in a given category or less, in one group compared to the other. In other words, the odds ratio for comparing the cumulative proportions in each group is constant for every ordered category from 1 to k-1 (cumulative proportion must equal one for the final kth category).
In nQuery 9.2, sample size determination for the analysis of ordinal data across two groups using the proportional odds model using the method of Whitehead (1993) and for the equivalent cluster randomized design.
Tests for Paired Proportions
What is it?
Paired (also referred to correlated) proportions refers to analysis where the outcome on a dichotomous variable will be compared between correlated measurements. For example, a measurement made before an intervention and after an intervention for each subject in a clinical trial.
The most commonly used test for paired proportions is the McNemar test. However, this test only deals with the case of two categories and where all observations are successfully made on a given subject. Extensions of the McNemar tests have been proposed to deal with these limitations.
For multiple categories, the McNemar Bowker test was proposed for analyzing two correlated measurements.. A test of symmetry is conducted on the k x k (k = number of categories) contingency tables of results.
For incomplete observations, extensions of McNemar’s Test that uses the information provided by pairs that are only partially observed were given in Thompson (1995), Ekbohm (1982) and Choi and Stablein (1982). These tests require the estimation of the two marginal probabilities from the complete and the partial data and the difference of these two estimates is used for the test.
In nQuery 9.2, sample size determination for the analysis of paired proportions using the McNemar Bowker test for multiple categories and the tests proposed in the presence of incomplete observations are provided.
Survival (Time-to-Event) Analysis
What is it?
Survival or Time-to-Event trials are trials in which the endpoint of interest is the time until a particular event occurs, for example death or tumour regression. Survival analysis is often encountered in areas such as oncology or cardiology.
In nQuery 9.2, sample size tables are added in the following areas for the design of trials involving survival analysis:
Maximum Combination (MaxCombo) Tests
What is it?
Combination Tests represent a unified approach to sample size determination for the unweighted and weighted log-rank tests under Proportional Hazard (PH) and Non-Proportional Hazard (NPH) patterns.
The log-rank test is one of the most widely used tests for the comparison of survival curves. However, a number of alternative linear-rank tests are available. The most common reason to use an alternative test is that the performance of the log-rank test depends on the proportional hazards assumption and may suffer significant power loss if the treatment effect (hazard ratio) is not constant. While the standard log-rank test assigns equal importance to each event, weighted log-rank tests apply a prespecified weight function to each event. However, there are many types of non-proportional hazards (delayed treatment effect, diminishing effect, crossing survival curves) so choosing the most appropriate weighted log-rank test can be difficult if the treatment effect profile is unknown at the design stage.
The maximum combination test can be used to compare multiple test statistics and select the most appropriate linear rank-test based on the data, while controlling the Type I error by adjusting for the multiplicity due to the correlation of test statistics. In this release, one new table is being added in the area of maximum combination tests.
In nQuery 9.2, we add to our inequality MaxCombo sample size table from nQuery 9.1 by adding a sample size determination table for Non-inferiority Testing using the MaxCombo Test.
Linear-Rank Tests for Piecewise Survival
(Log-Rank, Wilcoxon, Tarone-Ware, Peto-Peto, Fleming-Harrington, Threshold Lag, Generalized Linear Lag)
What is it?
The log-rank test is one of the most widely used tests for the comparison of survival curves. However, a number of alternative linear-rank tests are available. The most common reason to use an alternative test is that the performance of the log-rank test depends on the proportional hazards assumption and may suffer significant power loss if the treatment effect (hazard ratio) is not constant. While the standard log-rank test assigns equal importance to each event, weighted log-rank tests apply a prespecified weight function to each event. However, there are many types of non-proportional hazards (delayed treatment effect, diminishing effect, crossing survival curves) so choosing the most appropriate weighted log-rank test can be difficult if the treatment effect profile is unknown at the design stage.
In nQuery 9.2, sample size determination is provided for seven linear-rank tests with flexible piecewise survival for both inequality (superiority) and non-inferiority testing. These nQuery tables can be used to easily compare the power achieved or sample size required for the Log-Rank, Wilcoxon, Tarone-Ware, Peto-Peto, Fleming-Harrington, Threshold Lag and Generalized Linear Lag and complement the MaxCombo tables provided when interested in evaluating multiple tests simultaneously.
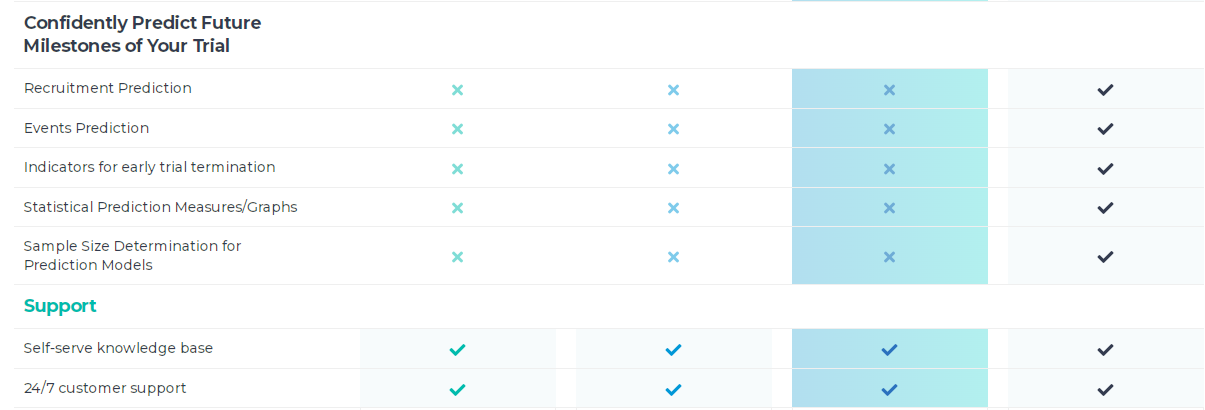
The New Prediction Module
(Included in the Expert Tier)
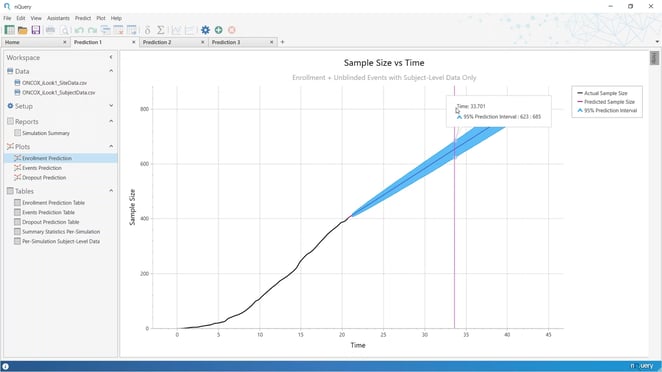
What is nQuery Predict?
Featured in our last release, nQuery Predict is a new module that uses simulation to help trialists make better predictions about when key trial milestones will occur.
With nQuery Predict, you gain access to tools that accurately predict key enrollment and event milestones both before and while a trial is ongoing. This gives you the ability to identify roadblocks and take action to keep your trial on schedule.
What are the main features of nQuery Predict in this release?
- Enrollment prediction
- Event prediction
Enrollment prediction
Enrollment prediction (i.e. how long will it take to achieve the desired sample size of patients) is a common issue across all trials and has direct impacts on the administration of a clinical trial.
Delays in patient enrollment or trial events create additional costs. With nQuery Predict, you can ensure the best performance by examining projections at both the planning stage and interim monitoring.
Event prediction
Event prediction is a complex problem in trials, such as those in oncology that plan to use survival analysis.
Key decisions such as when to conduct an interim analysis or when to conduct right-censoring to finish the study are most commonly based on a priori unknown time when a given number of subjects will have had an event rather than based on the fixed follow-up more common in other areas. This means that accurate projections of when event milestones will be achieved are vital to provide realistic estimates of expected timings and costs.
nQuery Predict provides tools to project events based on both blinded (where treatment group is unknown) and unblinded (where treatment group is known) using multiple event models (exponential, piecewise, Weibull) and design considerations (e.g. fixed follow-up per subject).