描述
FCS Express 流式細胞術軟體
產品特色
Pipelines
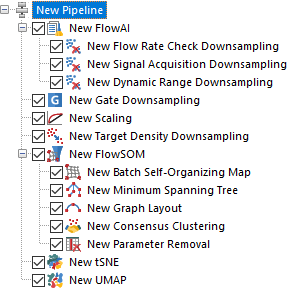
Pipelines in FCS Express are a set of data processing steps that stand alone or are connected in series. The output of a step can be applied to a data file or utilized as the input of the next step, or series of steps, that may be applied to your data. No plugins, no programming, just results!The vast majority of commonly used algorithms for data analysis are actually pipelines, with tSNE (and its variants) and SPADE being two examples. However, when those algorithms are implemented as a one calculation, user customizations are limited to the what the specific implementation allows. Pipelines in FCS Express increase the computational flexibility and granularity of running algorithms and data transformations while giving users the unique ability to create their own transformations.A pipeline is made of individual data processing steps with each step performing a specific calculation/transformation.
| Pre-defined pipeline steps (FlowAI, FlowCut, FlowSOM, SPADE,…) make accessing commonly used algorithms and data processing steps easy. | 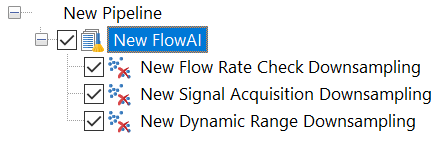 |
 |
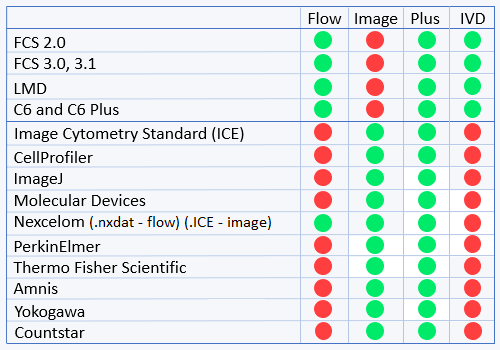
FCS Express provides a wide variety of pipeline steps for you to choose from. See our full list of all available steps and contact us if there are steps you are interested incorporating into FCS Express that are not yet available. |
Integrated Spreadsheets
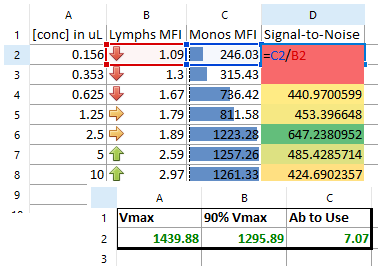
Have you ever wished you could link up your statistics from files, gates, and plots directly to Excel? FCS Express provides integrated spreadsheets that update in real-time as gates or data change using tokens.
| Drag and drop gated populations to populate a spreadsheet. Pull many data files from the Data List into the spreadsheet to compare samples and generate results automatically. |  |
 |
You already know how to use spreadsheets since you are an expert in Excel. |
| Customize spreadsheets with many of the advanced Excel tools you know, including conditional formatting, so you can get to your results easier and faster. | 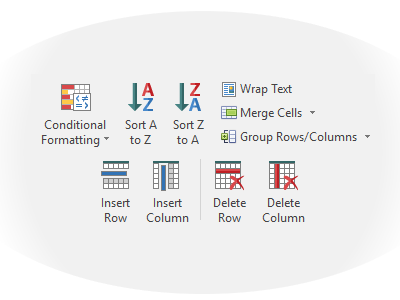 |
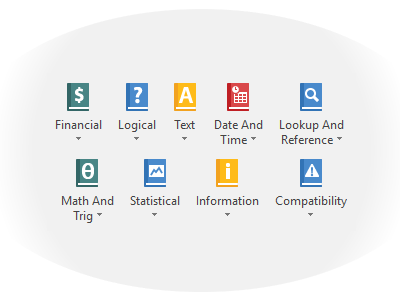 |
Looking for a formula function? FCS Express has you covered with many of the same formulas provided in Excel. |
| Spreadsheets Formula Hints provide all the details needed to get started on your analysis. Skip the manual lookups and go straight to results! | 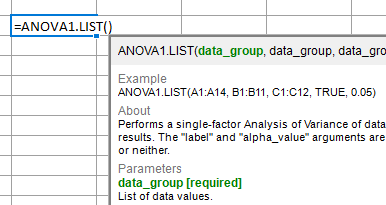 |
Publication-Ready Graphics
When it comes to your data, publication-quality results are important. FCS Express provides publication-ready graphics every time you analyze a sample in several formats at any resolution.
| The right plot for your analysis is always at your fingertips. | 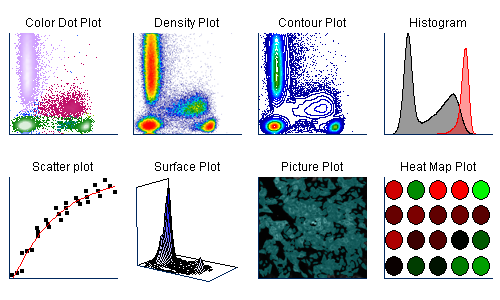 |
 |
Customize every aspect of your plots as you are analyzing or by creating defaults, so you are ready to move instantly from the raw data to your publication. |
| Format your any axis with custom labels and gridlines or tick marks. | 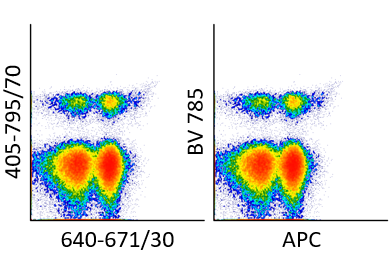 |
 |
Use black and white or grayscale plots to avoid color page fees. |
Spectral Analysis
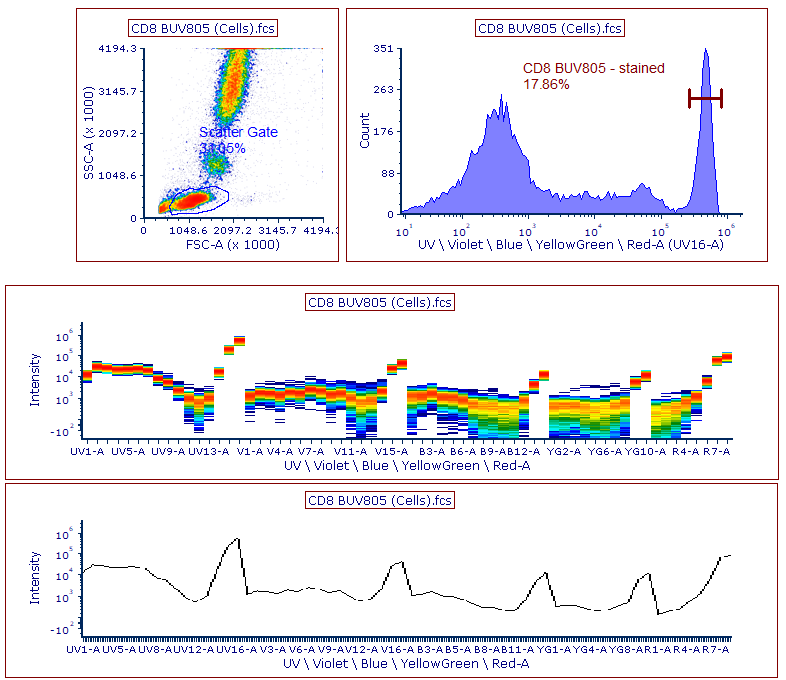
Take advantage of the only third-party software capable of displaying your spectral data from Cytek and Sony instruments.
| Apply gates to visualize subsets of interest along spectra. |  |
 |
Create gates to analyze populations further or backgate on other plots. |
| Overlay multiple samples or populations in a single plot for easy visual comparison. |  |
 |
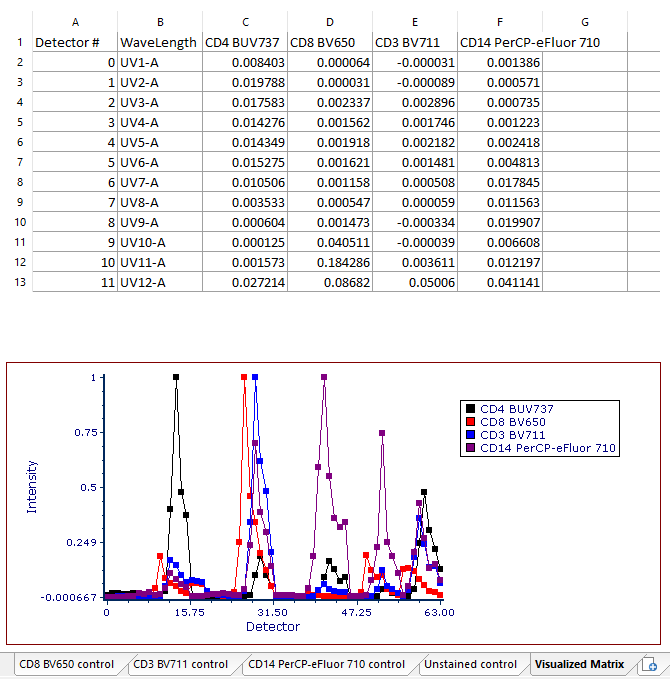
Perform Spectral Unmixing from single stained controls directly in FCS Express. As adjustments are made to the compensation setup, and/or directly to the matrix, your flow cytometry analysis will update immediately to help you visualize changes based on your controls without delay. |
A Visualized Matrix can also be created for any created or imported unmixing matrix added to a layout. FCS Express will automatically generate a Visualized Matrix by simply using a right-click on the desired unmixing matrix in the Compensation and Unmixing editor by choosing Build Visualized Matrix. The Visualized matrix page includes a spreadsheet with charted values and a chart displaying the Detector vs Intensity for each single stained control added in the Automatic Unmixing Setup.
FCS Express makes it easy and convenient to view unmixed spectral signatures. The Visualized Matrix is one of many new features that takes your analysis in FCS Express to the next level.
Spillover Spreading Matrix (SSM) and Cross Staining Index (CSI) matrix are both automatically calculated at the end of the Compensation/Unmixing wizard.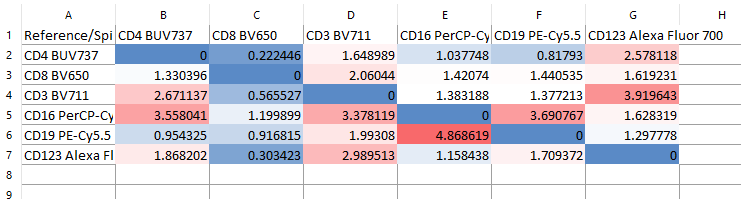
Cell Cycle Analysis
| Eliminate tedious, and often biased, manual gating by using Multicycle AV for your cell cycle analysis. Multicycle is included in every copy of FCS Express and can display up to three cycles with background, debris, and aggregate correction within a sample. |
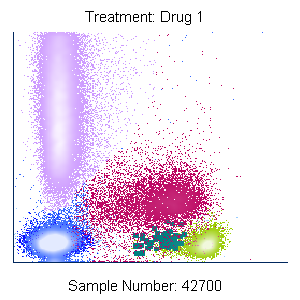
| Your samples will be modeled as displayed for gated or ungated data. | 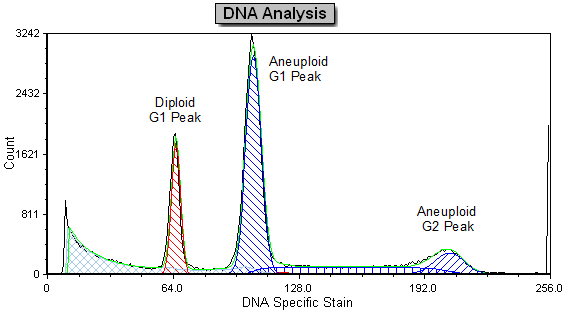 |
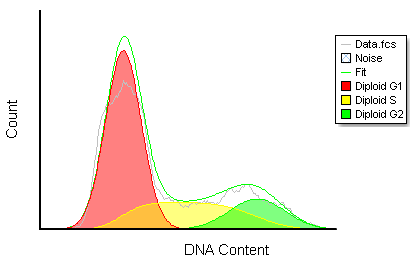 |
Customize the Multicycle plot to display your results for sharing or reporting how you need it. |
| Interpretation guidelines and statistics can be inserted into the layout and included with batch processing. | 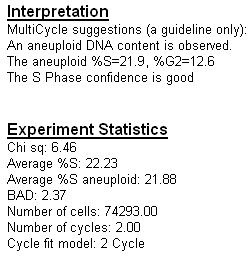 |
Remember Scaling Formula
FCS Express remembers manually adjusted scaling. No longer will users have to adjust each plot, once a change has been made to a plot parameter all plots displaying the same parameter will automatically update. Optimizing how data is displayed on your plot has never been easier.